Actuary Salary in Michigan: $111,135 (2026)
Quick Answer:Across Michigan's 52 metropolitan areas, the average median actuary pay sits at $111,135/year heading into 2026 — a figure projected from 2025 BLS OEWS wage data for SOC 15-2011. Because Michigan sits at BEA RPP 93.2 (7% below the U.S. baseline), that statewide median translates to roughly $119,244 in nationally-comparable purchasing power. Highest-paying metros: Clinton Township ($125,274), Ann Arbor ($124,129), Sterling Heights ($123,698).
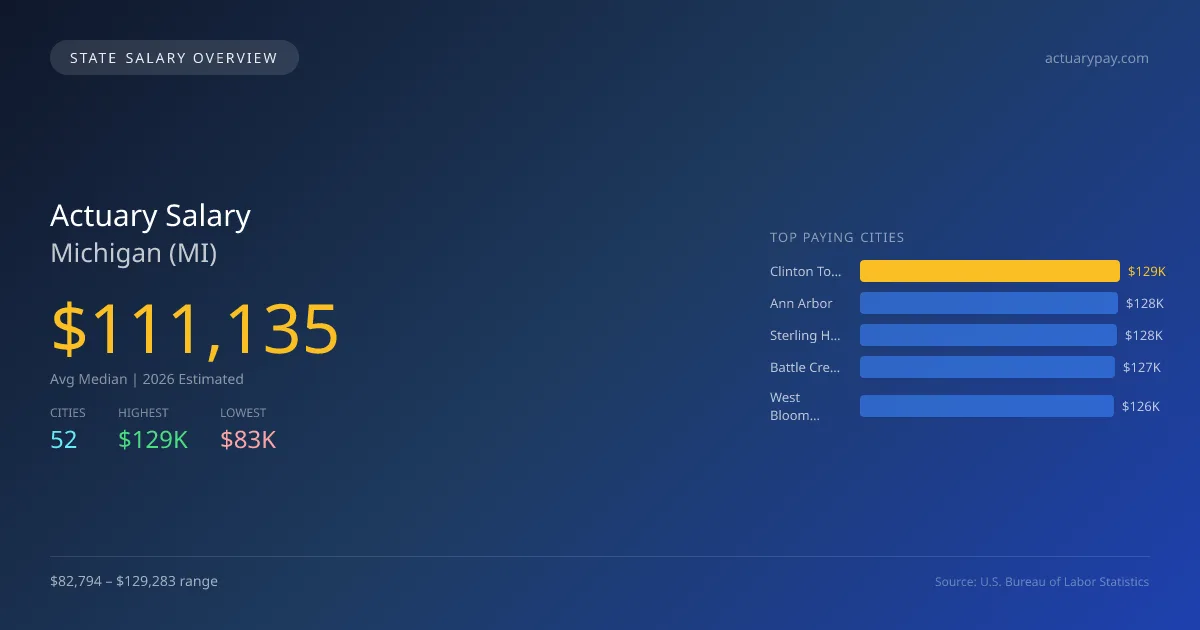
In 2026, the average median salary for actuaries in Michigan is projected to be $111,135, which is significantly lower than the national median of $134,160, reflecting a difference of 17.2%. The salary range across the state varies considerably, with the highest being in Clinton Township at $129,283 and the lowest in East Lansing at $82,794. This nearly $46,500 gap can be attributed to factors such as local demand, the concentration of financial and insurance services, and the cost of living in different cities. Michigan has specific licensing requirements and regulatory frameworks that affect actuaries' practice scope. The state's demand for actuaries is supported by growth in industries such as insurance, healthcare, and financial services, where actuaries play a key role in risk assessment and management. With a projected annual growth rate of 3.20%, the job market for actuaries in Michigan appears stable, providing ample opportunities for new entrants and current professionals. Key cities like Ann Arbor and Sterling Heights also offer competitive salaries, indicating a favorable market for actuaries in these areas. Overall, the outlook for actuaries in Michigan is positive, despite the salary rates being lower than the national figures.
Michigan Actuary Salary Range
Overall salary range in Michigan: $54,160 (lowest entry-level) to $200,389 (highest top earner)
Michigan vs National Average
Michigan actuaries earn 17.16% less than the national median ($-23,025/year difference).
Michigan Actuary Salary Distribution (2026)
Actuary salaries in Michigan range from $71,209 (entry-level, 10th percentile) to $180,728 (top earners, 90th percentile), with a median of $111,135. The Michigan median is $23,025 below the US national median of $134,160. The average hourly rate is $53.43/hr. Approximately 1,073 actuarys are employed across 52 cities.
2019 BLS Actual
$92,575
2025 BLS Actual
$107,689
2026 Current Est.
$111,135
2019–2027 Growth
+23.9%
Salary Trajectory for Actuaries in Michigan (2019–2027)
2019–2025: actual BLS OEWS data for this metro area. 2026+: CAGR 3.20% projection.
| Year | Annual Salary | Status |
|---|---|---|
| 2019 | $92,575 | Actual |
| 2020 | $82,277 | Actual |
| 2021 | $79,099 | Actual |
| 2022 | $88,263 | Actual |
| 2023 | $92,511 | Actual |
| 2024 | $111,052 | Actual |
| 2025 | $107,689 | Actual |
| 2026(current) | $111,135 | Estimated |
| 2027 | $114,691 | Projected |
Based on 7 years of BLS OEWS data for the Michigan metropolitan area, the median actuary salary grew 16.3% from $92,575 (2019) to $107,689 (2025). At a 3.20% compound annual growth rate, salaries are projected to reach $114,691 by 2027 — a total increase of $22,116 (23.89%) from 2019.
Note: Historical values (2019–2025) are actual BLS OEWS figures for the Michigan metropolitan area, sourced from annual Occupational Employment and Wage Statistics surveys. 2026–2026 figures are current estimates, and 2027 values are projections, calculated using a 3.20% CAGR derived from 7-year BLS historical data. Actual salaries may vary based on employer, experience, certifications, and local market conditions.
Top 5 Highest Paying Cities in Michigan
Lowest Paying Cities in Michigan
| City | Median Salary |
|---|---|
| East Lansing | $82,794 |
| Lansing | $83,499 |
| Kentwood | $98,543 |
| Grand Rapids | $100,321 |
| Wyoming | $101,561 |
Best Value Cities for Actuaries in Michigan
When adjusted for local cost of living, these Michigan cities offer the most purchasing power for actuaries.
| City | Nominal Salary | CoL Index | Adjusted Salary |
|---|---|---|---|
| Clinton Township | $129,283 | 93.2 | $138,716 |
| Ann Arbor | $128,101 | 93.2 | $137,447 |
| Sterling Heights | $127,656 | 93.2 | $136,970 |
| Battle Creek | $126,564 | 93.2 | $135,798 |
| West Bloomfield | $126,366 | 93.2 | $135,586 |
Adjusted salary = nominal salary × (100 / CoL index). CoL index: 100 = national average. Lower index = lower cost of living.
Salary by Experience Level in Michigan
| Experience Level | Estimated Annual |
|---|---|
| Entry Level (0-2 years) | $71,209 |
| Mid Career (3-7 years) | $111,135 |
| Experienced (7+ years) | $180,728 |
Estimates based on BLS percentile data averaged across Michigan metro areas. Individual pay varies by employer, certifications, and specialization.
All 52 Cities in Michigan
| # | City | Median Salary |
|---|---|---|
| 1 | Clinton Township | $129,283 |
| 2 | Ann Arbor | $128,101 |
| 3 | Sterling Heights | $127,656 |
| 4 | Battle Creek | $126,564 |
| 5 | West Bloomfield | $126,366 |
| 6 | Kalamazoo | $126,327 |
| 7 | Shelby Township | $126,079 |
| 8 | Troy | $125,812 |
| 9 | Westland | $125,485 |
| 10 | Farmington Hills | $125,218 |
| 11 | Dearborn Heights | $124,940 |
| 12 | Southfield | $124,703 |
| 13 | Macomb Township | $124,435 |
| 14 | St. Clair Shores | $124,297 |
| 15 | Rochester Hills | $124,227 |
| 16 | Bay City | $124,124 |
| 17 | Taylor | $123,881 |
| 18 | Port Huron | $123,532 |
| 19 | Royal Oak | $123,505 |
| 20 | Lincoln Park | $123,416 |
| 21 | Jackson | $123,310 |
| 22 | Saginaw | $123,222 |
| 23 | Livonia | $123,168 |
| 24 | Canton | $122,247 |
| 25 | Novi | $122,207 |
| 26 | Auburn Hills | $122,087 |
| 27 | Waterford | $122,020 |
| 28 | Muskegon | $121,864 |
| 29 | Roseville | $121,796 |
| 30 | Flint | $121,722 |
| 31 | Garden City | $121,554 |
| 32 | Allen Park | $120,826 |
| 33 | Pontiac | $120,742 |
| 34 | Marquette | $120,426 |
| 35 | Norton Shores | $120,398 |
| 36 | Inkster | $120,238 |
| 37 | Midland | $119,534 |
| 38 | Holland | $119,486 |
| 39 | Ferndale | $118,658 |
| 40 | Traverse City | $118,329 |
| 41 | Portage | $118,254 |
| 42 | Mount Pleasant | $116,637 |
| 43 | Ypsilanti | $116,298 |
| 44 | Romulus | $115,630 |
| 45 | Detroit | $109,020 |
| 46 | Dearborn | $108,458 |
| 47 | Warren | $108,074 |
| 48 | Wyoming | $101,561 |
| 49 | Grand Rapids | $100,321 |
| 50 | Kentwood | $98,543 |
| 51 | Lansing | $83,499 |
| 52 | East Lansing | $82,794 |
More Michigan Salary Data
Hourly Rates
Explore actuary hourly pay in Michigan cities.
Senior / Experienced
Top earner salaries for experienced actuaries.
Compare Cities in Michigan
View all comparisons →Explore More Actuary Salary Data
Frequently Asked Questions
How much do actuaries make in Michigan in 2026?
What is the highest paying city for actuaries in Michigan?
How does Michigan actuary pay compare to the national average?
What is the entry-level actuary salary in Michigan?
How many actuaries are employed in Michigan?
Which Michigan city offers the best value for actuaries?
Written by Maria Chen, FSA, MAAA
Career Analyst
Maria has 10 years of experience in life insurance. She specializes in risk assessment and pricing strategies.
Methodology & Data Source
Statewide salary figures on this page are 2026 projections based on the Bureau of Labor Statistics Occupational Employment and Wage Statistics (OEWS) survey, May 2026 release. A 3.20% compound annual growth rate (CAGR), derived from 6-year national BLS wage trends, was applied to each metro area's reported salary to estimate current 2026 actuary compensation across Michigan. State averages are employment-weighted across 52 metro areas — larger metro areas with more actuariescontribute proportionally more to the average, producing figures that better reflect typical compensation. Individual pay varies by city, employer, certifications, and experience.
Data Sources & Methodology
Source: BLS, OEWS, 7-year dataset (–). Per-city data from annual BLS metropolitan area surveys.
2026 figures are projected from 2025 BLS data using a compound annual growth rate (CAGR) of 3.20%, derived from historical BLS wage trends for actuarys (SOC 15-2011).
Compiled and verified by Maria Chen, FSA, MAAA, a licensed actuary with 10+ years of clinical experience. · View source data at BLS.gov