Actuary Salary in Washington: $140,902 (2026)
Quick Answer:Across Washington's 49 metropolitan areas, the average median actuary pay sits at $140,902/year heading into 2026 — a figure projected from 2025 BLS OEWS wage data for SOC 15-2011. Because Washington sits at BEA RPP 107.4 (7% above the U.S. baseline), that statewide median translates to roughly $131,194 in nationally-comparable purchasing power. Highest-paying metros: Spokane Valley ($143,729), Renton ($143,267), Everett ($141,879).
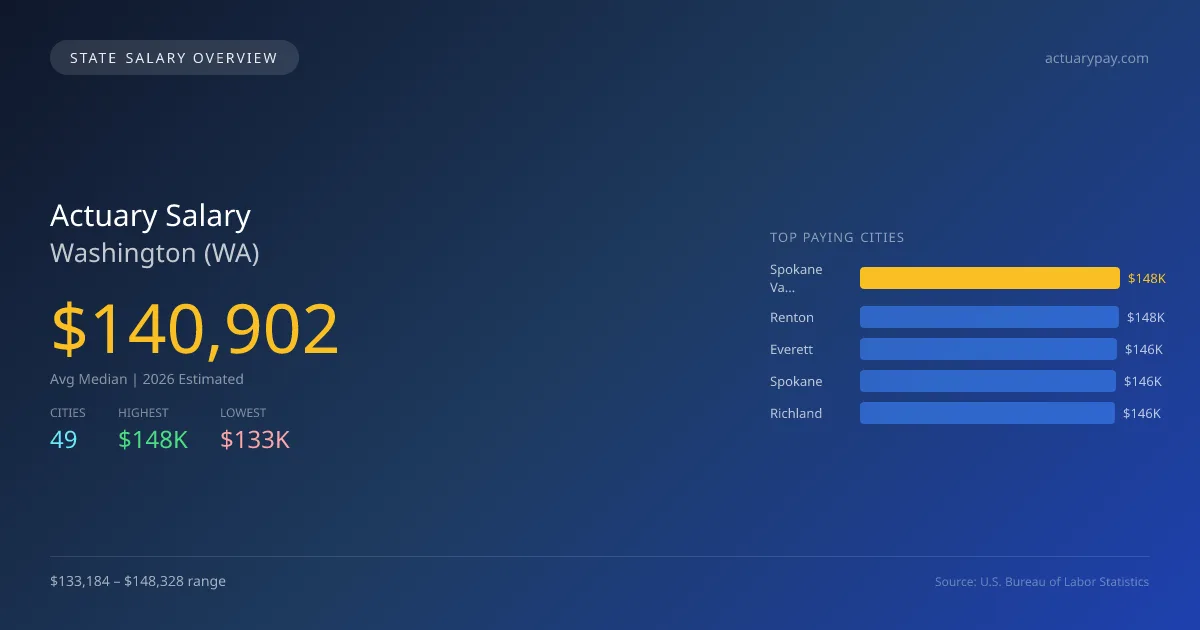
In Washington, the average median salary for actuaries in 2026 is projected to be $140,902, which is 5.0% higher than the national median of $134,160. The city of Spokane Valley leads the state with a salary of $148,328, while Tukwila offers the lowest at $133,184. This $15,144 salary gap can be attributed to various factors, including local demand for actuarial services, the size and scope of the regional insurance markets, and differences in the cost of living. Washington's unique state licensing requirements and scope of practice laws can influence an actuary's opportunities and salary potential. The state's growing economy and increasing complexity in risk management continue to drive demand for skilled actuaries. With a projected annual growth rate of 3.20%, the job market for actuaries in Washington appears promising. The top cities for actuarial positions in 2026 also include Renton at $147,852, Everett at $146,419, Spokane at $146,101, and Richland at $145,619. These cities reflect variations in local industry needs, investment in financial services, and access to relevant educational resources. Overall, Washington presents a strong landscape for actuaries with favorable salary prospects and ongoing demand.
Washington Actuary Salary Range
Overall salary range in Washington: $77,772 (lowest entry-level) to $229,909 (highest top earner)
Washington vs National Average
Washington actuaries earn 5.03% more than the national median (+$6,742/year difference).
Washington Actuary Salary Distribution (2026)
Actuary salaries in Washington range from $85,917 (entry-level, 10th percentile) to $218,679 (top earners, 90th percentile), with a median of $140,902. The Washington median is $6,742 above the US national median of $134,160. The average hourly rate is $67.74/hr. Approximately 889 actuarys are employed across 49 cities.
2019 BLS Actual
$132,560
2025 BLS Actual
$136,533
2026 Current Est.
$140,902
2019–2027 Growth
+9.7%
Salary Trajectory for Actuaries in Washington (2019–2027)
2019–2025: actual BLS OEWS data for this metro area. 2026+: CAGR 3.20% projection.
| Year | Annual Salary | Status |
|---|---|---|
| 2019 | $132,560 | Actual |
| 2020 | $129,890 | Actual |
| 2021 | $102,930 | Actual |
| 2022 | $127,350 | Actual |
| 2023 | $132,924 | Actual |
| 2024 | $139,870 | Actual |
| 2025 | $136,533 | Actual |
| 2026(current) | $140,902 | Estimated |
| 2027 | $145,410 | Projected |
Based on 7 years of BLS OEWS data for the Washington metropolitan area, the median actuary salary grew 3.0% from $132,560 (2019) to $136,533 (2025). At a 3.20% compound annual growth rate, salaries are projected to reach $145,410 by 2027 — a total increase of $12,850 (9.69%) from 2019.
Note: Historical values (2019–2025) are actual BLS OEWS figures for the Washington metropolitan area, sourced from annual Occupational Employment and Wage Statistics surveys. 2026–2026 figures are current estimates, and 2027 values are projections, calculated using a 3.20% CAGR derived from 7-year BLS historical data. Actual salaries may vary based on employer, experience, certifications, and local market conditions.
Top 5 Highest Paying Cities in Washington
Lowest Paying Cities in Washington
| City | Median Salary |
|---|---|
| Tukwila | $133,184 |
| Mountlake Terrace | $133,389 |
| Vancouver | $134,089 |
| Covington | $135,264 |
| Kenmore | $135,275 |
Best Value Cities for Actuaries in Washington
When adjusted for local cost of living, these Washington cities offer the most purchasing power for actuaries.
| City | Nominal Salary | CoL Index | Adjusted Salary |
|---|---|---|---|
| Spokane Valley | $148,328 | 107.4 | $138,108 |
| Renton | $147,852 | 107.4 | $137,665 |
| Everett | $146,419 | 107.4 | $136,331 |
| Spokane | $146,101 | 107.4 | $136,034 |
| Richland | $145,619 | 107.4 | $135,586 |
Adjusted salary = nominal salary × (100 / CoL index). CoL index: 100 = national average. Lower index = lower cost of living.
Salary by Experience Level in Washington
| Experience Level | Estimated Annual |
|---|---|
| Entry Level (0-2 years) | $85,917 |
| Mid Career (3-7 years) | $140,902 |
| Experienced (7+ years) | $218,679 |
Estimates based on BLS percentile data averaged across Washington metro areas. Individual pay varies by employer, certifications, and specialization.
All 49 Cities in Washington
| # | City | Median Salary |
|---|---|---|
| 1 | Spokane Valley | $148,328 |
| 2 | Renton | $147,852 |
| 3 | Everett | $146,419 |
| 4 | Spokane | $146,101 |
| 5 | Richland | $145,619 |
| 6 | Marysville | $145,323 |
| 7 | Shoreline | $144,524 |
| 8 | Bellingham | $143,965 |
| 9 | Redmond | $143,954 |
| 10 | Kent | $143,835 |
| 11 | Kirkland | $143,600 |
| 12 | Burien | $143,417 |
| 13 | Kennewick | $142,950 |
| 14 | Federal Way | $142,786 |
| 15 | Des Moines | $142,757 |
| 16 | Olympia | $142,715 |
| 17 | Auburn | $142,424 |
| 18 | Lakewood | $142,367 |
| 19 | Issaquah | $142,287 |
| 20 | Lacey | $141,477 |
| 21 | Sammamish | $141,352 |
| 22 | University Place | $141,302 |
| 23 | SeaTac | $141,191 |
| 24 | Tumwater | $141,046 |
| 25 | Pasco | $140,587 |
| 26 | Longview | $140,520 |
| 27 | Bellevue | $140,393 |
| 28 | Mount Vernon | $140,162 |
| 29 | Edmonds | $139,726 |
| 30 | Lake Stevens | $139,357 |
| 31 | Lynnwood | $139,267 |
| 32 | Seattle | $139,031 |
| 33 | Moses Lake | $138,999 |
| 34 | Bothell | $138,899 |
| 35 | Pullman | $138,284 |
| 36 | Puyallup | $137,970 |
| 37 | Ellensburg | $137,452 |
| 38 | Maple Valley | $137,076 |
| 39 | Bremerton | $136,931 |
| 40 | Walla Walla | $136,774 |
| 41 | Camas | $136,730 |
| 42 | Tacoma | $136,712 |
| 43 | Wenatchee | $136,617 |
| 44 | Oak Harbor | $136,153 |
| 45 | Kenmore | $135,275 |
| 46 | Covington | $135,264 |
| 47 | Vancouver | $134,089 |
| 48 | Mountlake Terrace | $133,389 |
| 49 | Tukwila | $133,184 |
More Washington Salary Data
Compare Cities in Washington
View all comparisons →Explore More Actuary Salary Data
Frequently Asked Questions
How much do actuaries make in Washington in 2026?
What is the highest paying city for actuaries in Washington?
How does Washington actuary pay compare to the national average?
What is the entry-level actuary salary in Washington?
How many actuaries are employed in Washington?
Which Washington city offers the best value for actuaries?
Written by Maria Chen, FSA, MAAA
Career Analyst
Maria has 10 years of experience in life insurance. She specializes in risk assessment and pricing strategies.
Methodology & Data Source
Statewide salary figures on this page are 2026 projections based on the Bureau of Labor Statistics Occupational Employment and Wage Statistics (OEWS) survey, May 2026 release. A 3.20% compound annual growth rate (CAGR), derived from 6-year national BLS wage trends, was applied to each metro area's reported salary to estimate current 2026 actuary compensation across Washington. State averages are employment-weighted across 49 metro areas — larger metro areas with more actuariescontribute proportionally more to the average, producing figures that better reflect typical compensation. Individual pay varies by city, employer, certifications, and experience.
Data Sources & Methodology
Source: BLS, OEWS, 7-year dataset (–). Per-city data from annual BLS metropolitan area surveys.
2026 figures are projected from 2025 BLS data using a compound annual growth rate (CAGR) of 3.20%, derived from historical BLS wage trends for actuarys (SOC 15-2011).
Compiled and verified by Maria Chen, FSA, MAAA, a licensed actuary with 10+ years of clinical experience. · View source data at BLS.gov